Tag: Press Release

Mapping The World’s Most Popular Video Games
The world has reached a golden age of video game development. But what types of games do people play the most?
Most Popular Video Games By US State (2023)
| Alabama | NCAA Football |
| Alaska | Halo |
| Arizona | Game of Thrones: Winter Is Coming |
| Arkansas | Mario Odyssey |
| California | Undisputed |
| Colorado | Marvel’s Spider Man |
| Connecticut | Minecraft |
| Delaware | The Last of Us |
| Florida | Twisted Metal |
| Georgia | The Last of Us |
| Hawaii | The Last of Us |
| Idaho | Hogwarts Legacy |
| Illinois | High on Life |
| Indiana | FIFA |
| Iowa | LEGO Indiana Jones |
| Kansas | Legend of Zelda: Tears of the Kingdom |
| Kentucky | Starfield |
| Louisiana | Street Fighter |
| Maine | Starfield |
| Maryland | Outlast |
| Massachusetts | PGA 2K23 |
| Michigan | High on Life |
| Minnesota | Hades |
| Mississippi | Mortal Kombat |
| Missouri | Hogwarts Legacy |
| Montana | LEGO Star Wars |
| Nebraska | MLB The Show 23 |
| Nevada | DOOM |
| New Hampshire | Stray |
| New Jersey | Starfield |
| New Mexico | Hogwarts Legacy |
| New York | NHL 23 |
| North Carolina | NCAA Football |
| North Dakota | Super Mario |
| Ohio | Portal |
| Oklahoma | South Park: Phone Destroyer |
| Oregon | High on Life |
| Pennsylvania | Legend of Zelda: Tears of the Kingdom |
| Rhode Island | The Last of Us |
| South Carolina | The Last of Us |
| South Dakota | NCAA Football |
| Tennessee | Starfield |
| Texas | Evil Dead: The Game |
| Utah | Starfield |
| Vermont | The Sims 4 |
| Virginia | It Takes Two |
| Washington | Warhammer 40,000 |
| West Virginia | Undertale |
| Wisconsin | Mortal Kombat |
| Wyoming | Super Mario |
Video games aren’t strictly an American phenomenon — millions of people around the world love kicking back with their favorite games.
A Look At The World’s Top 5 Video Game Genres
- First Person Shooter (like Duck Hunt – 28.3 million copies sold)
- Popularity by age group
- 16 – 24: 66%
- 25 – 34: 64%
- 35 – 44: 56%
- 45 – 54: 43%
- 55 – 64: 32%
- Popularity by age group
- Action adventure (like The Last of Us – 20 million copies sold)
- Popularity by age group
- 16 – 24: 62%
- 25 – 34: 60%
- 35 – 44: 54%
- 45 – 54: 44%
- 55 – 64: 33%
- Popularity by age group
- Simulation (like Minecraft – 230 million copies sold)
- Popularity by age group
- 16 – 24: 43%
- 25 – 34: 43%
- 35 – 44: 38%
- 45 – 54: 29%
- 55 – 64: 22%
- Popularity by age group
- Multiplayer online battle arena (MOBA) (like Honor of Kings – 100 million daily players)
- Popularity by age group
- 16 – 24: 42%
- 25 – 34: 43%
- 35 – 44: 35%
- 45 – 54: 24%
- 55 – 64: 18%
- Popularity by age group
- Sports (like FIFA – 325 million copies sold)
- Popularity by age group
- 16 – 24: 41%
- 25 – 34: 44%
- 35 – 44: 42%
- 45 – 54: 31%
- 55 – 64: 24%
- Popularity by age group
Mapping The Most Popular Video Games In The World (2023)
- France: Pokémon Legends: Arceus
- Germany: Mario Kart 8 Deluxe
- United Kingdom: Call of Duty: Modern Warfare II
- US: Madden NFL
- Japan: Pikmin 4
- China: Honor of Kings
- Russia: God of War Ragnarök
- Canada: Remnant II
- Australia: The Legend of Zelda: Tears of the Kingdom
What Video Game Genres Are Breaking New Ground?
- AR and VR gaming
- Augmented reality and virtual reality games have taken the world by storm
- In 2023:
- There are 98 million people using VR
- There are 23 million using AR
- By 2027:
- Both AR and VR are may surpass 100 million users worldwide
- In 2023:
- Globally, the most popular AR and VR games on Steam include:
- War Thunder (all-time peak of 113,250 players)
- Phasmophobia (all-time peak of 112,717 players)
- VR Chat (all-time peak of 46,814 players)
- Augmented reality and virtual reality games have taken the world by storm
- Fitness gaming
- There’s a renaissance of ‘exergaming’ for players who want to get off the couch
- The VR fitness market may grow 40% between 2023 and 2029
- Globally, the most popular fitness games include:
- Wii Fit (82.9 million copies sold)
- Ring Fit Adventure (15 million copies sold)
- Just Dance (80 million copies sold)
- There’s a renaissance of ‘exergaming’ for players who want to get off the couch
- Casino gaming
- There are now 4,792 online gaming businesses located worldwide
- That’s a 29.25% growth rate since 2018
- Globally, the most popular casino games and platforms include:
- Coin Master ($61.58 million in revenue)
- Bingo Blitz ($19.38 million in revenue)
- Jackpot Party Casino Slots ($17.82 million in revenue)
- There are now 4,792 online gaming businesses located worldwide
For gamers of any country or creed, the global gaming industry has never looked brighter.
Sources
- https://www.pewresearch.org/fact-tank/2022/09/14/as-more-states-legalize-the-practice-19-of-u-s-adults-say-they-have-bet-money-on-sports-in-the-past-year/
- https://www.htfmarketreport.com/reports/4233113-global-vr-fitness-game-market-growth
- https://www.statista.com/chart/28467/virtual-and-augmented-reality-adoption-forecast/
- https://www.statista.com/statistics/1263585/top-video-game-genres-worldwide-by-age/
- https://www.statista.com/statistics/1318204/top-ranked-video-games-sales-europe-platform/
- https://www.statista.com/statistics/1310712/japan-monthly-top-ranked-video-games-sales/
- https://www.statista.com/statistics/1175228/china-top-grossing-game-apps/
- https://www.statista.com/statistics/1310823/australia-weekly-top-video-games-sales/
- https://www.statista.com/statistics/1376705/top-ranked-video-games-sales-canada
- https://www.cbr.com/best-selling-action-adventure-games-of-all-time/#the-last-of-us
- https://vgsales.fandom.com/wiki/Best_selling_first-person_shooters
- https://www.businessofapps.com/data/minecraft-statistics/
- https://www.honorofkings.com/global-en/
- https://www.gamesindustry.biz/ea-extends-uefa-exclusivity-working-on-multiple-fifa-mobile-games
- https://www.statista.com/statistics/1366802/ubisoft-video-game-unit-sales/
- https://www.cbr.com/fitness-gaming-exergaming-2023/
- https://www.statista.com/statistics/259851/top-grossing-casino-gaming-apps/
- https://steamdb.info/charts/
UK vs Canada: Observing the Trends in Different Online Gambling Markets
EXECUTIVE SUMMARY
OBJECTIVE
The purpose of this study was to investigate the prevalence of gambling in within the United Kingdom (UK) and Canada and to establish any trends which may affect this at an individual level.
METHODOLOGY
An anonymous multiple-choice survey was conducted using a survey platform, with individuals over 18 from the UK and Canada, who reported partaking in gambling activities at least once before, invited to participate. A total of 220 participants were involved in the study, split equally between the UK and Canada; but those from Ontario, Canada, were excluded from the study since the province is semi-regulated.
Key Results
The typical demographic of an online gambler in the UK or Canada, is a male between the ages of 30-44 with a distinct preference for Sports Betting. Strikingly this demographic is extremely similar for both countries, with the nuances only developing when you dig deeper into the age, gender, and personality type preferences.
Conclusions
Expected trends were observed with regards to both gender and device type, with there being a slightly higher prevalence of males than females, and those under 30 more likely to use a mobile than a desktop PC. However, while it was expected that the age demographic would be lower in Canada than the UK, this was not observed within the research.
Recommendations
One recommendation is for further research in young Desktop PC users, since those who reported the lowest introduction to gambling age, also reported their preferred device to be a Windows Desktop PCs. This raises significant safeguarding concerns and may require intervention. Additionally, whilst it was expected and observed that mobile devices were the preference, there was a higher-than-expected prevalence of desktop users in Canada which must also be accounted for.
COMMISSIONED
The research was commissioned and fully funded by Minimum Deposit Casinos.
BACKGROUND & OBJECTIVES
MARKET SIZE
Within the UK, gambling is legal and regulated by the Gambling Commission, which ultimately reports to the Department for Digital, Culture, Media and Sport (DCMS) within the UK government. As of March 2022, the gambling industry within the UK is estimated to be in excess of £14 billion, an increase of 10% from the previous years’ figures. Online gambling specifically is responsible for £6.4 billion but reported a small decrease of 6% for the same time-frame, likely reflecting the impact of the COVID pandemic (Statista, 2022).
Within Canada, gambling is regulated by each local province. It is generally allowed, except for in the province of Ontario where the Ontario Lottery and Gaming Corporation is the sole legal vendor. As of 2021, the gambling market in Canada was valued at $12.5 billion (USD), a 2% decrease from the previous year but it’s estimated that there are still approximately 19.3 million active online gamblers (Statista, 2022).
RATIONALE
It is crucial to understand what demographic of the population are the most frequent and active users, alongside what barriers those out-with that typical demographic may be facing in order to improve the experience for all. These metrics can also assist with helping to identify problem gambling and target interventions where required.
RESEARCH
As per the rationale, the key questions that this survey hopes to address are;
- What is the typical demographic of online gambler in the UK?
- What is the typical demographic of online gambler in Canada?
- How does the typical UK demographic differ from the Canadian demographic?
- Are there any variances in how different ages or genders experience gambling?
OUTCOMES
GENDER
From previous research, it’s estimated that the gender divide will be moderately proportional with a slightly higher prevalence of males than females (Gambling Commission, 2020; Williams, et al., 2021).
AGE
There’s expected to be a large average age variance between the UK and Canada for online gambling; previous research has indicated that the largest age demographic of online gamblers in the UK is 35-54 years, whereas in Canada this is significantly lower with most being under 25 (Statista, 2022; Williams, et al., 2021).
FREQUENCY
It’s expected that most respondents will report partaking in gambling activities once a month, regardless of whether they are based in the UK or Canada (Gambling Commission, 2020; Williams, et al., 2021).
DEVICE
It’s expected that those under 30 will be more likely to use a mobile device such as a phone or tablet to access online gambling platforms then those over 30 (Gambling Commission, 2020).
METHODOLOGY
INTRODUCTION
It is crucial to understand what demographic of the population the most frequent and active users are, alongside what barriers those out-with that typical demographic may be facing in order to improve the experience for all. These metrics can also assist with helping to identify problem gambling and target interventions where required.
As per the rationale, the key questions that this survey hopes to address are:
- What is the typical demographic of online gambler in the UK?
- What is the typical demographic of online gambler in Canada?
- How does the typical UK demographic differ from the Canadian demographic?
- Are there any variances in how different ages or genders experience gambling?
TARGET AUDIENCE
The research aimed to recruit 220 participants with an even split between the UK and Canada, who were over 18 and reported partaking in online gambling at least once previously. Those from Ontario, Canada, were excluded from the study since the province is semi-regulated.
PARTICIPANTS
A total of 220 participants were recruited as planned; from the UK there were 43 females and 67 males, and from Canada, 31 females and 79 males.
DATA COLLECTION
Participants were anonymously recruited through a partnership with an online survey platform. Following this, the participants answered 13 (UK) or 14 (Canada) questions which comprised a variety of free-text, multiple choice and Likert scales on gambling habits, political afflictions, and general demographics (see Appendix B – Survey Questions).
DATA PROTECTION
At no point during the survey were participants asked to provide Personally Identifiable Information such as name, address or postcode. The anonymous nature of this survey remained of upmost importance to the research team throughout the study, and the data which was collected was shared on a needs-basis only, in compliance with strict data protection protocols.
LIMITATIONS
Due to the anonymous nature of the survey, it’s expected that any response bias would be minimal – since the participants would receive no gain from targeting their answers any particular way. However, due to the disproportional split between male (66.4%) and female participants (33.6%) the data may be skewed in favour of male behaviours. Similar proportions are a concern for age, with 48% falling into the 30-44 demographic.
RESULTS
GENDER
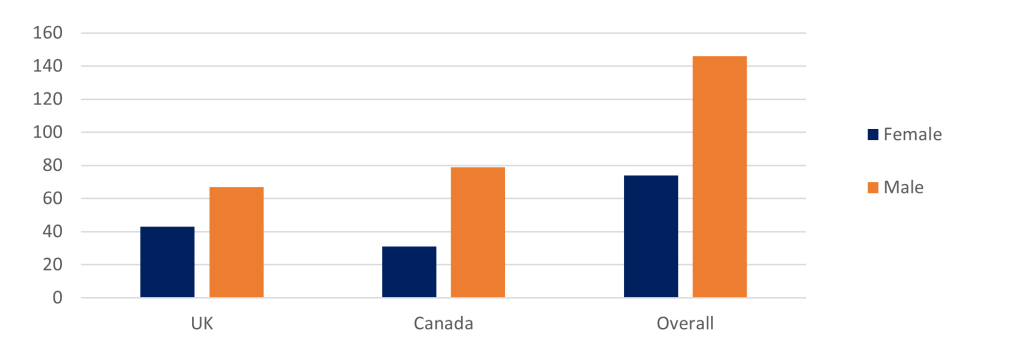
Most respondents across both countries were male, with the total proportional split approximately 2:1. Considering that previous studies have indicated a majority of online gamblers are male (Gambling Commission, 2020; Williams, et al., 2021) and the pre-requisite of previously partaking in online gambling activities, this is not unexpected. this may feature as a limitation of the study since it is not proportionate to the general population.
AGE
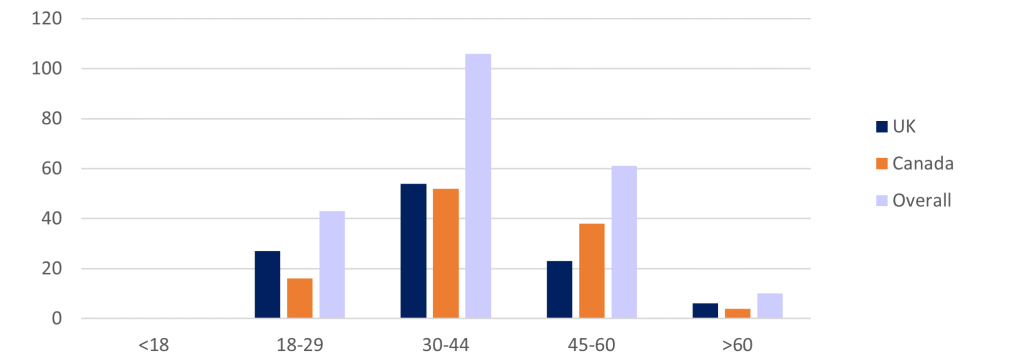
While there was expected to be a large average age variance between the UK and Canada for online gambling, with previous research indicating the largest age demographic in the UK is 35-54 years, compared to under 25s in Canada (Statista, 2022; Williams, et al., 2021) these findings were not replicated. This could be for several reasons, including the method of participant recruitment, or it may be a genuine demographical shift.
DEVICE TYPE
| Android Mobile | iOS Mobile | Other Mobile | ALL Mobile | Mac Desktop | Windows Desktop | ALL Desktop | |
|---|---|---|---|---|---|---|---|
| Canada | 32 | 28 | 3 | 63 | 7 | 40 | 47 |
| 18 – 29 | 4 | 7 | 11 | 2 | 3 | 5 | |
| 30 – 44 | 15 | 16 | 2 | 33 | 3 | 16 | 19 |
| 45 – 60 | 11 | 4 | 1 | 16 | 2 | 20 | 22 |
| Over 60 | 2 | 1 | 3 | 1 | 1 | ||
| UK | 52 | 45 | 1 | 98 | 1 | 11 | 12 |
| 18 – 29 | 6 | 17 | 1 | 24 | 3 | 3 | |
| 30 – 44 | 28 | 22 | 50 | 4 | 4 | ||
| 45 – 60 | 15 | 6 | 21 | 2 | 2 | ||
| Over 60 | 3 | 3 | 1 | 2 | 3 | ||
| Grand Total | 84 | 73 | 4 | 161 | 8 | 51 | 59 |
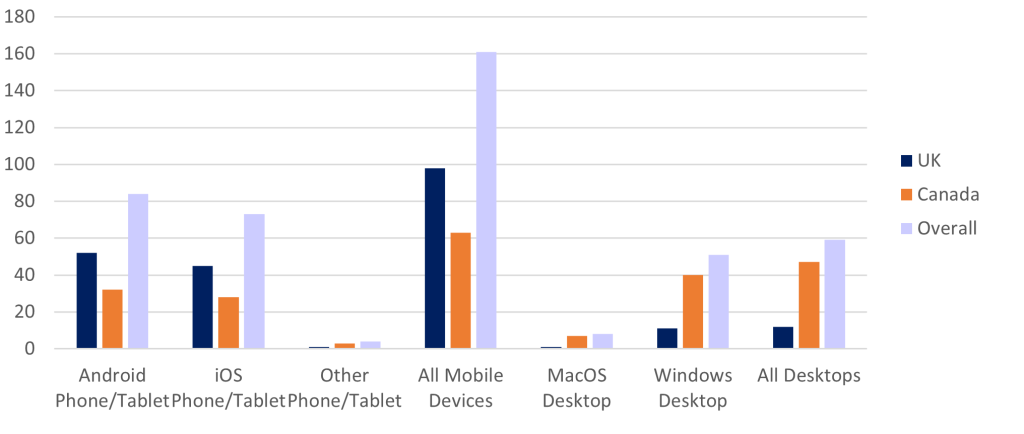
The most popular device type for accessing online gambling is mobile devices, however desktops do account for a greater proportion of participants in Canada than the UK. Since websites require to be optimised for mobile or desktop, this is an important finding for improving the users’ experience, particularly for companies operating within Canada.
INTRODUCTION TO GAMBLING
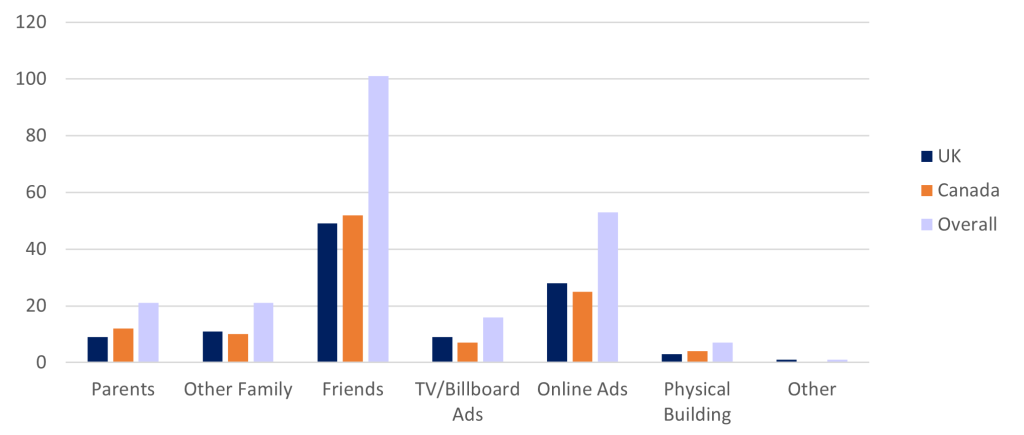
Most participants, regardless of country, reported that they were introduced to gambling by their friends. There are no significant differences or trends between countries for this metric with reports remarkably even across all mechanisms of introduction.
First Gambling Experience
The average age at which participants reported having their first gambling experience was slightly younger for the UK (24) than Canada (26). There were 13 participants from the UK and 15 from Canada that reported their first gambling experience taking place below the age of 18, with three Canadian and one British participant reporting their first experience as young as 8. Interestingly, each of these 4 participants also report that they use Windows Desktop PCs for online gambling, and that they were introduced by either their parents or friends.
| Current Age Group | 18 – 29 | 30 – 44 | 45 – 60 | Over 60 |
|---|---|---|---|---|
| Canada | 18.5 | 25.3 | 28.3 | 42.8 |
| Female | 19.0 | 27.2 | 38.4 | 50.0 |
| Male | 18.4 | 24.1 | 26.0 | 40.3 |
| UK | 21.9 | 22.4 | 28.9 | 32.2 |
| Female | 20.2 | 24.5 | 35.4 | |
| Male | 23.2 | 21.2 | 23.8 | 32.2 |
| Grand Total | 20.6 | 23.8 | 28.5 | 36.4 |
Gambling Game Preferences
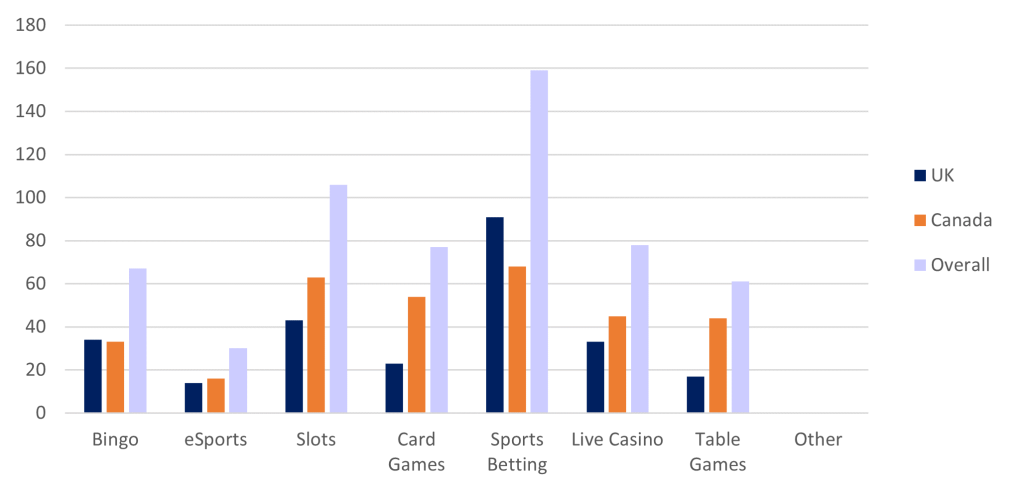
| Do you enjoy: | Bingo | eSports | Slots | Card Games | Live Casino | Table Games | Sports Betting |
|---|---|---|---|---|---|---|---|
| Canada | 33 | 16 | 63 | 54 | 45 | 44 | 68 |
| Female | 18 | 6 | 20 | 16 | 14 | 14 | 12 |
| 18 – 29 | 2 | 1 | 1 | 1 | 1 | 1 | 1 |
| 30 – 44 | 13 | 4 | 13 | 9 | 8 | 8 | 8 |
| 45 – 60 | 3 | 1 | 6 | 5 | 5 | 5 | 3 |
| Over 60 | 1 | ||||||
| Male | 15 | 10 | 43 | 38 | 31 | 30 | 56 |
| 18 – 29 | 3 | 1 | 6 | 6 | 8 | 4 | 10 |
| 30 – 44 | 9 | 7 | 16 | 13 | 11 | 13 | 24 |
| 45 – 60 | 3 | 2 | 19 | 17 | 12 | 11 | 20 |
| Over 60 | 2 | 2 | 2 | 2 | |||
| UK | 34 | 14 | 43 | 23 | 33 | 17 | 91 |
| Female | 20 | 8 | 19 | 10 | 18 | 6 | 32 |
| 18 – 29 | 7 | 4 | 4 | 6 | 5 | 2 | 9 |
| 30 – 44 | 8 | 3 | 11 | 3 | 10 | 3 | 14 |
| 45 – 60 | 5 | 1 | 4 | 1 | 3 | 1 | 9 |
| Male | 14 | 6 | 24 | 13 | 15 | 11 | 59 |
| 18 – 29 | 4 | 2 | 5 | 4 | 5 | 2 | 13 |
| 30 – 44 | 5 | 3 | 13 | 8 | 10 | 8 | 30 |
| 45 – 60 | 2 | 1 | 4 | 1 | 1 | 12 | |
| Over 60 | 3 | 2 | 4 | ||||
| Grand Total | 68 | 31 | 107 | 78 | 79 | 62 | 160 |
The game which most respondents reported enjoying regardless of country was Sports Betting; in Canada, this was closely followed by Slots. This may be a consequence of brick-and-mortar institutions comprising a larger proportion of the overall gambling market in Canada than the UK (Williams, et al., 2021), however it is not possible to draw that as a direct conclusion.
When taking gender and current age range into account, in addition to country, it becomes apparent that the Canadian preference towards Sports Betting and Slots is heavily weighted towards the male contingent – with females preferring Slots then Bingo. This trend is not observed in the UK, as the preference for both males and females are Sports Betting, followed by Slots for males and Bingo for females (see Figure 7).
Quantity of Providers Tried
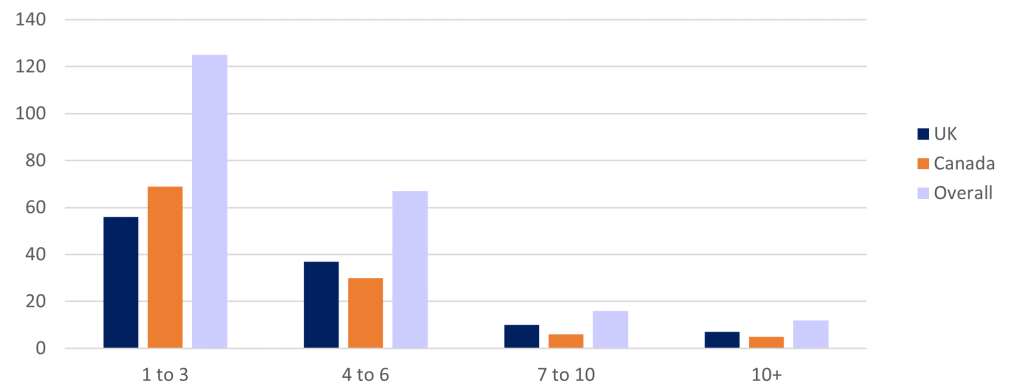
| Different Providers Tried | 1-3 | 4-6 | 7-10 | 10+ |
|---|---|---|---|---|
| Canada | 69 | 30 | 6 | 5 |
| 18 – 29 | 11 | 5 | ||
| 30 – 44 | 31 | 14 | 4 | 3 |
| 45 – 60 | 24 | 10 | 2 | 2 |
| Over 60 | 3 | 1 | ||
| UK | 56 | 37 | 10 | 7 |
| 18 – 29 | 19 | 5 | 3 | |
| 30 – 44 | 19 | 23 | 5 | 7 |
| 45 – 60 | 15 | 7 | 1 | |
| Over 60 | 3 | 2 | 1 | |
| Grand Total | 125 | 67 | 16 | 12 |
The majority of participants reported using between 1 and 3 different websites or betting providers in the past, with the frequency decreasing for each incremental increase. There are slight differences between each country, with those in the UK being slightly more likely to try 4 or more providers than their Canadian counterparts. However, overall the results to follow the expected trends.
Biggest Wins
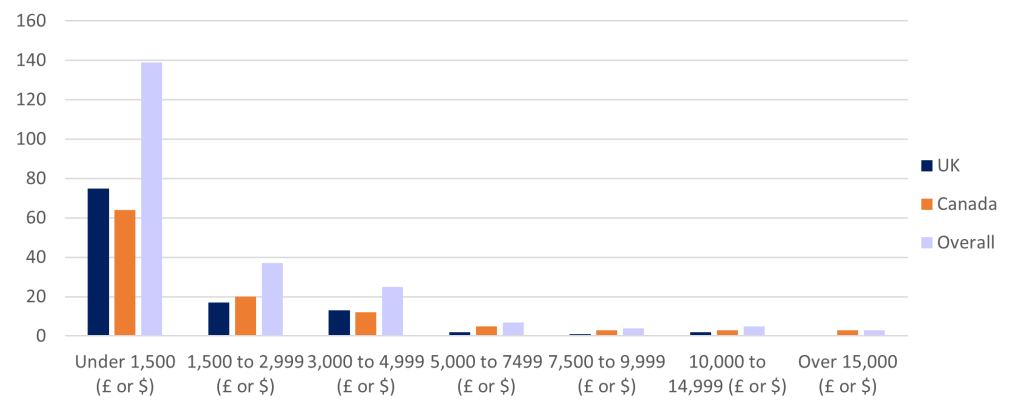
Smaller wins were reported with a far greater frequency, with most participants reporting their biggest win as being under £1,500 (UK) or $1,500 (Canada). There were slightly less Canadians in the first category, with more in the second, however this may be accounted for by the difference in value when taking exchange rates into account (as of March 2023, $1500 USD equates to approximately £1212 GBP).
Personality Traits
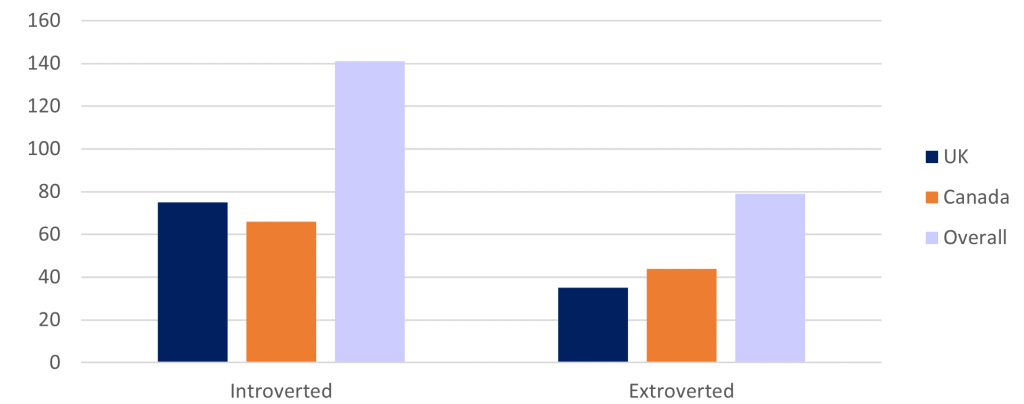
| Bingo | eSports | Slots | Card Games | Live Casino | Table Games | Sports Betting | |
|---|---|---|---|---|---|---|---|
| Canada | 33 | 16 | 63 | 54 | 45 | 44 | 68 |
| Extroverted | 12 | 6 | 28 | 26 | 21 | 23 | 27 |
| Introverted | 21 | 10 | 35 | 28 | 24 | 21 | 41 |
| UK | 34 | 14 | 43 | 23 | 33 | 17 | 91 |
| Extroverted | 7 | 6 | 16 | 9 | 10 | 6 | 29 |
| Introverted | 27 | 8 | 27 | 14 | 23 | 11 | 62 |
| Grand Total | 68 | 31 | 107 | 78 | 79 | 62 | 160 |
Most participants from both countries reported that they would classify themselves as more introverted than extroverted. With regards to gambling game preferences and the influence of introvert or extrovert personality traits, the preferences remain the same in Canada with both Sports Betting and Slots taking the top spots, and within the UK with Sports Betting taking the top spot. However, within the UK, the second-place position is split between Bingo and Slots for introverts – similar to the gender divide previously discussed.
Social Activities
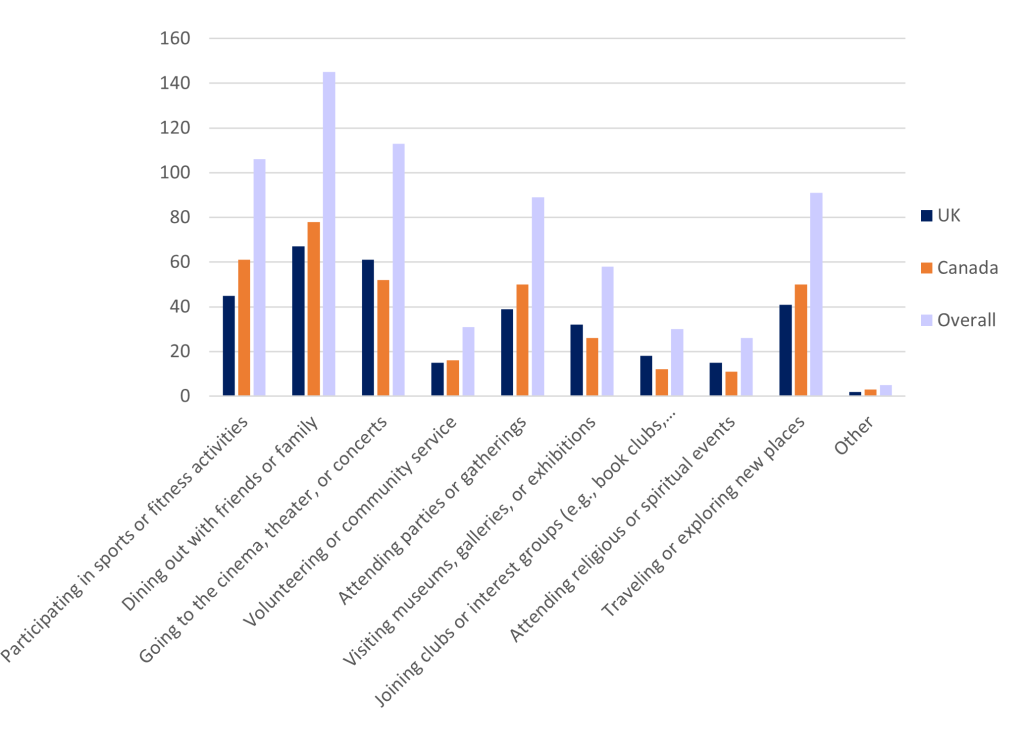
Respondents reported partaking in a variety of social activities, with the most popular being dining out with friends or family. There were two participants who reported being both introverted and not enjoying partaking in any of the suggested or other activities; both participants were from Canada. However, there were no other significant differences between social activity participation between the UK and Canada.
Opinion on Regulations & Political Leaning
| Should there be more or fewer regulations for online casinos, in your opinion? | What is your personal political leaning? | |
|---|---|---|
| Canada | 0.77 | -0.16 |
| 18 – 29 | 0.94 | -0.44 |
| Female | 0.00 | 0.67 |
| Male | 1.15 | -0.69 |
| 30 – 44 | 0.52 | -0.17 |
| Female | 0.45 | 0.00 |
| Male | 0.56 | -0.28 |
| 45 – 60 | 1.00 | -0.21 |
| Female | 0.57 | 0.00 |
| Male | 1.10 | -0.26 |
| Over 60 | 1.25 | 1.50 |
| Female | 0.00 | -1.00 |
| Male | 1.67 | 2.33 |
| UK | 0.77 | -0.01 |
| 18 – 29 | 0.85 | 0.04 |
| Female | 0.83 | -0.25 |
| Male | 0.87 | 0.27 |
| 30 – 44 | 0.81 | -0.02 |
| Female | 0.90 | -0.10 |
| Male | 0.76 | 0.03 |
| 45 – 60 | 0.48 | 0.00 |
| Female | 0.00 | -0.30 |
| Male | 0.85 | 0.23 |
| Over 60 | 1.17 | -0.17 |
| Male | 1.17 | -0.17 |
| Grand Total | 0.77 | -0.09 |
When asked whether there should be more or fewer regulations for online casinos on a Likert scale of -3 (less) to +3 (more), the average score for both UK and Canadian participants was 1. This indicates that there is a lean towards more regulation in both countries.
To eliminate an element of participant bias, respondents were asked which way they were swayed politically from -3 (left-leaning) to +3 (right-leaning). Although there were slightly more left-wing views from Canadian respondents with a cumulative total of -18 compared to -1 in the UK, the average for both nations was almost neutral (-0.16 for Canada, and -0.01 for the UK).
Generally, the over 60s from both countries reported that there should be more regulations, although political affliction does not appear to be a driver for this – since it’s right-leaning within Canada (1.5) and left-leaning in the UK (-0.17).
Gambling on Religious Holidays
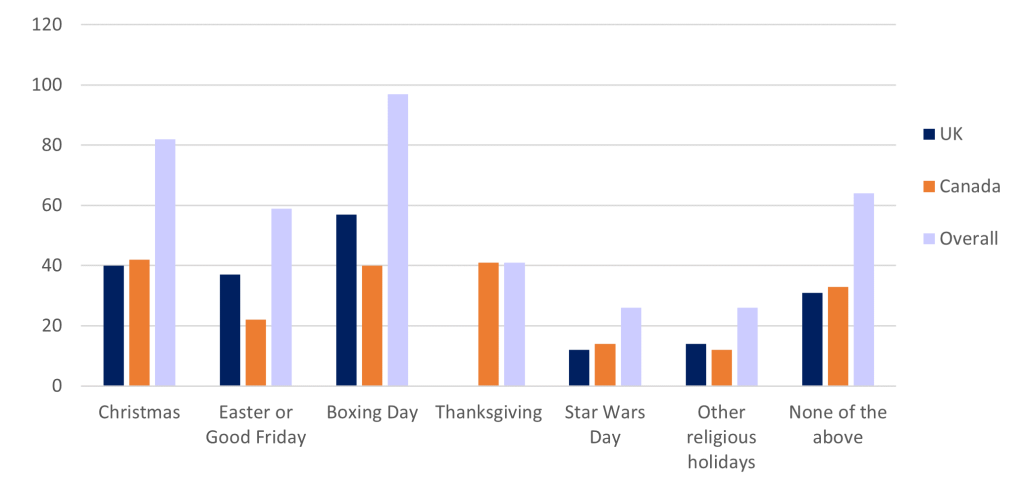
Only 64 participants, evenly split between the UK and Canada, recorded never having bet on any religious holidays. This is most likely the most reliable statistic, as it may be difficult to recall exactly what days you have and have not partaking in gambling – particularly if you don’t celebrate that event.
Response to Research Questions
The typical demographic of an online gambler in the UK or Canada, is a male between the ages of 30-44 with a distinct preference for Sports Betting. Strikingly this demographic is extremely similar for both countries, with the nuances only developing when you dig deeper into the age, gender, and personality type preferences.
Review of Expected Outcomes
Gender
From previous research, it was both expected and observed that the gender divide would be moderately proportional with a slightly higher prevalence of males than females (Gambling Commission, 2020; Williams, et al., 2021), although this was more prominent in Canada than the UK.
Age
There was expected to be a large average age variance between the UK and Canada for online gambling, since previous research has indicated that the largest age demographic of online gamblers in the UK is 35-54 years, whereas in Canada this is significantly lower with most being under 25 (Statista, 2022; Williams, et al., 2021). Unfortunately, as age was only recorded as a range it was not possible to calculate an average, but the most frequently selected age group for both countries was 30-44. However, there were also fewer respondents aged between 18-29 from Canada (16) than the UK (27) so it appears that the opposite of what was expected has been observed.
Device
It was expected that those under 30 would be more likely to use a mobile device such as a phone or tablet to access online gambling platforms than those over 30 (Gambling Commission, 2020), and this was observed for both Canada and the UK.
Research Limitations
Since a pre-requisite for participation was prior participation in online gambling, the data is automatically skewed and not proportional of the total population – as some will be non-gamblers. There will be a segment of society who do not partake in gambling at all, and although not relevant to the experience of gamblers, what barriers they may face to entry (for example, adaptations for blindness) may be crucial for improving the overall online gambling experience.
A further limitation of the research was the data collection method, using Survey Monkey as a recruitment mechanism. Whilst this was for good reason and likely provided more benefit than harm, the difference in age demographic compared to previous research indicates there may be some disparity. It’s possible that the findings are not representative of the gambling population, based on what age demographic are more likely to be signed up to Survey Monkey, or take the time to participate in research.
Conclusion & Recommendations
In conclusion, expected trends were observed with regards to both gender and device type, with there being a slightly higher prevalence of males than females, and those under 30 more likely to use a mobile than a desktop PC. However, while it was expected that the age demographic would be lower in Canada than the UK, this was not observed within the research.
There were some limitations within the research, including a skew towards participants who have gambled previously, and a recruitment mechanism which favoured individuals more likely to take the time to respond to online surveys.
One recommendation, particularly taking safeguarding into account, is for further research in young Desktop PC users, since each of the 4 participants who reported partaking in gambling at the youngest age of 8 also reported their preferred device to be a Windows Desktop PCs. This may require intervention of some description, particularly within Canada, to prevent underage gambling, particularly considering the reported age for first gambling experiences decreasing generationally.
In terms of immediate actions to improve user experience, a primary difference in device type with Desktop PCs taking a larger contingent within Canada (43%) than the UK. So, whilst it was expected and observed that Mobile devices were the preference and therefore may attract more tailored experiences, there was a higher-than-expected prevalence of Desktop users in Canada which must also be accounted for. With regard to preferences, there is a Canadian preference towards Sports Betting and Slots but this is heavily weighted towards the male contingent – with females preferring Slots then Bingo. This trend is not observed in the UK, as the preference for both males and females are Sports Betting, followed by Slots for males and Bingo for females. Further research may be able to identify whether these preferences are as a direct result of better user experience in these games, or due to habits and hobbies – and the subsequent outcomes from this would enable targeted user experience improvements.
References
Gambling Commission, 2020. Taking a more in-depth look at online gambling. [Online]
Available at: https://www.gamblingcommission.gov.uk/statistics-and-research/publication/taking-a-more-in-depth-look-at-online-gambling
[Accessed 25 03 2023].
Statista, 2022. Gross gambling yield (GGY) of the online (remote) betting, bingo and casino industry in Great Britain from April 2010 to March 2022. [Online]
Available at: https://www.statista.com/statistics/467885/ggy-of-the-remote-gambling-industry-in-great-britain-uk/
[Accessed 25 01 2023].
Statista, 2022. Market size of the gambling sector in Canada from 2011 to 2021 with a forecast for 2022. [Online]
Available at: https://www.statista.com/markets/409/topic/438/gambling/#overview
[Accessed 25 03 2022].
Statista, 2022. Share of the public who gamble online in Great Britain from 2017 to 2021, by age group. [Online]
Available at: https://www.statista.com/statistics/543361/online-gambling-participation-united-kingdom-uk/
[Accessed 25 03 2022].
Williams, R. J. et al., 2021. Gambling and problem gambling in Canada in 2018: Prevalence and changes since 2002. The Canadian Journal of Psychiatry, 66(5), pp. 485-494.